

Multiple-wavelength operation is available for Metricon’s Model 2010/M to provide rapid and accurate curves of thin film and bulk material dispersion (index vs wavelength) similar to the results from a spectroscopic ellipsometer.
If index is measured at three or more wavelengths a complete index vs wavelength (dispersion) curve can be easily generated in just a few seconds using the built in Cauchy fitting software embedded in the 2010/M’s control software:
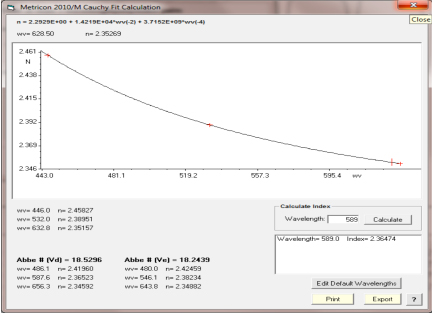
Fig. 1. Cauchy dispersion curve of GaN on sapphire from measurements at 446, 532 and 633 nm
The fit equation is provided, and for wavelength ranges in the visible, Vd and Ve Abbe numbers are calculated and displayed and the user can also select up to six default wavelengths for which index is automatically calculated (index is calculated at a single wavelength, 589 nm, in the above example). In addition, for materials with index 2.0 or less, Metricon’s new MetriconFit software allows extremely accurate determination of continuous index vs wavelength data from Model 2010/M measurements of index at just a few discrete wavelengths. For example, measurements at only three wavelengths, 405/473/635 nm or 635/980/1550 nm, can provide highly accurate dispersion curves over the 405-635 or 635-1550 nm ranges. For materials with index up to ~2.0, the worst case fitting error for these fits is less than .00006 (and for most materials and wavelengths fitting error will be much less than .00006). A fitting error of .00006 means that the fit adds no more than .00006 to the typical Model 2010/M measurement error of .0001-.0002 and, as a result, calculating index at any intermediate wavelength is only slightly less accurate than actually using a laser to measure the sample at that wavelength.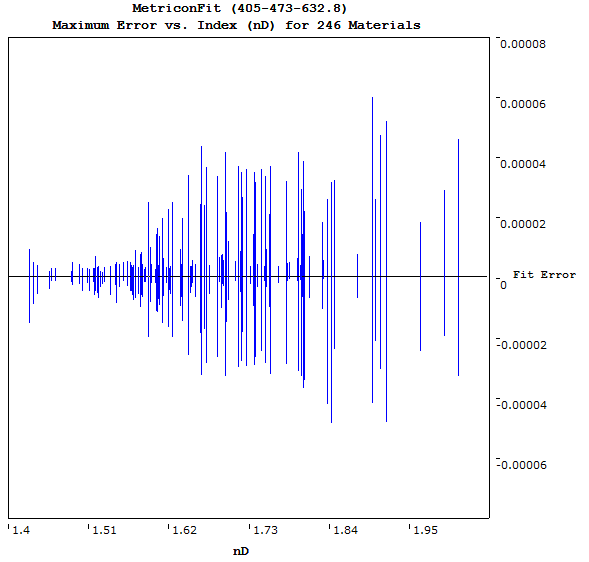 Fig. 2. Maximum MetriconFit error vs sodium D line index for 244 tested glass and crystalline test materials.
Related Products
-
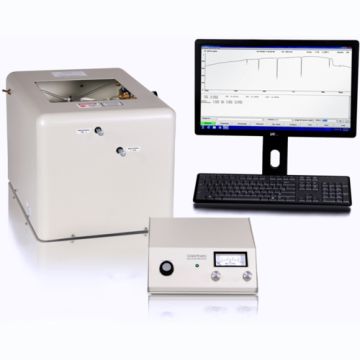
Refractive Index and Thin Film Thickness Measurement - Metricon Model 2010/M
The Metricon M2010/M Prism coupling system offers unmatched ease and accuracy for measuring:
- Refractive index and birefringence of bulk materials
- Refractive index and thickness of thin films
- Optical waveguide loss